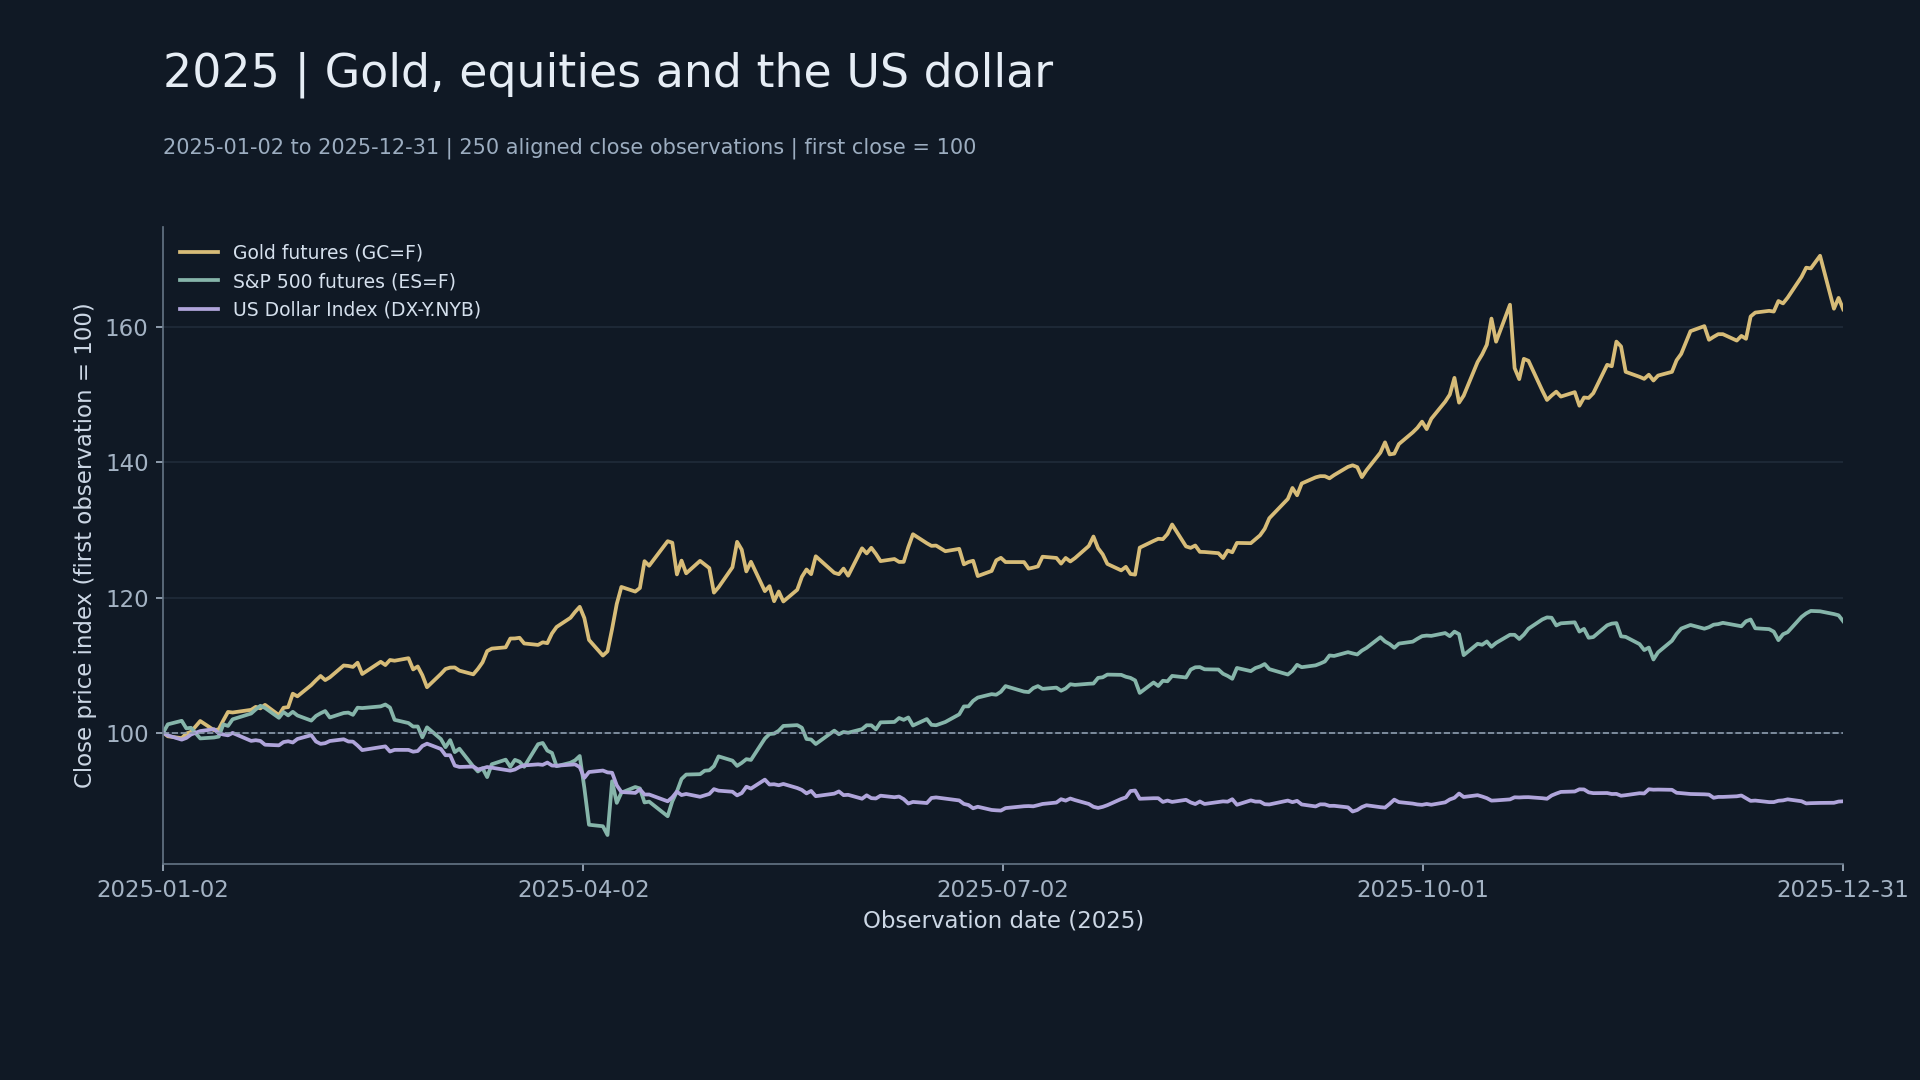
ResearchPrepared: January 2026

2025 actual drawdown vs. scenario amounts

Key findings

Risk budgets can’t just focus on the worst day. The maximum drawdown reflects the cumulative loss from the previous closing peak to the subsequent low; the increase required to restore the original value is greater than the absolute value of the decrease. This report first identifies the true peak and valley path, and then converts the price scenario into an amount to avoid mistakenly writing the historical drawdown as the upper limit of future losses.

Let’s look at actual data first for historical risks.

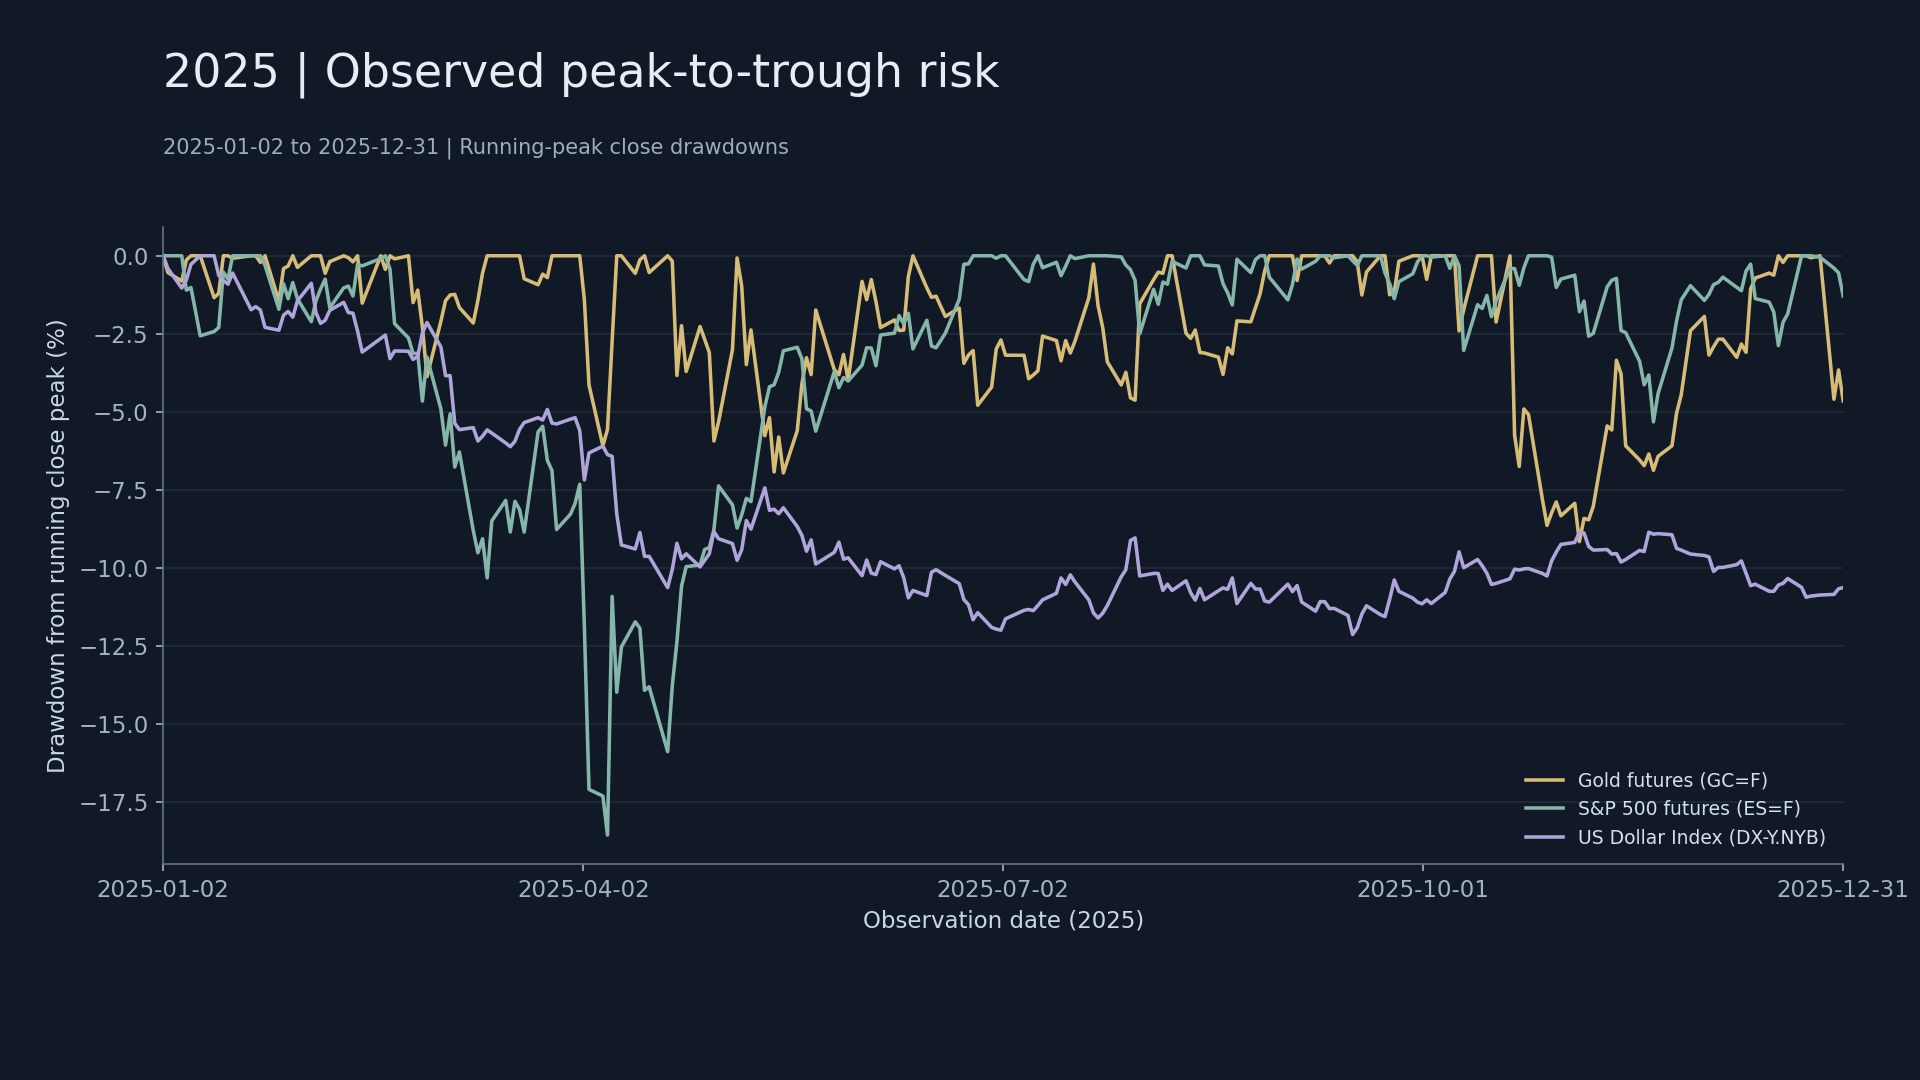
Each line in the chart uses the actual closing prices from 2025-01-02 to 2025-12-31 to calculate the decline from the highest closing price of the run. The graph shows historical changes without using simulated profit and loss sequences.

How to calculate drawdown

For each date, first calculate the highest closing price up to that day, and then calculate the day's closing/running peak − 1. This indicator ignores intraday lows and does not include transaction costs.

From historical research to scenario amounts

Use the risk calculator Calculator reference prices are from the last comparable trading days of 2025. Users can enter notional exposure, direction, price scenarios and costs. Net profit and loss = nominal exposure × price change rate × directional coefficient − round trip cost. With a $100,000 long exposure, a −5% price change, and a cost of $100, the calculated net profit or loss is −$5,100. This is the mathematical result under input assumptions, and the historical graph does not use these assumed values.

Peaks, Lows and Recovery Paths

Taking the highest closing price before each date and on that day as the running peak, select the peak and low corresponding to the deepest drawdown in the entire sample. The recovery date is defined as the first closing after the low point to reach the previous peak; if it does not reach it, the "not recovered within the observation period" is retained, and the end of the sample is not regarded as recovered.
MarketPeak day for closingDeepest drawdown dayLargest drawdownFirst recovery peak day
Gold Futures2025-10-202025-11-04-9.15%2025-12-17
S&P 500 Futures2025-02-192025-04-08-18.54%2025-06-26
U.S. Dollar Index2025-01-132025-09-16-12.12%Did not recover within the observation period
These dates are from the same price series and cannot be mixed with the intraday highs and lows. The definitions of intraday high and low drawdown and the closing drawdown of this table are different and should be compared separately and cannot be used interchangeably.

Loss and repair are not symmetrical

When an asset falls from 100 to 80, the loss is 20%, but recovering from 80 to 100 requires an increase of 25%. The increase required for recovery = 1 / (1 + drawdown rate) −1. The recovery gains corresponding to the maximum drawdown in this sample are: gold 10.07%, equity index 22.76%, and US U.S. dollar index 13.79%. This calculation only describes the mathematical repair requirements after a loss and does not predict recovery time. If the position has been closed due to margin or liquidity constraints before the low point, subsequent price recovery does not mean that investors have actually recovered their capital.

Clarify the denominator and direction of the amount

The inputs to the calculator are notional exposures, not account equity. Directional coefficients are +1 for longs and −1 for shorts; costs are deducted as dollar amounts. If the user inputs the number of futures contracts, the nominal exposure needs to be converted by combining the price, contract multiplier and contract quantity first. The number of contracts cannot be directly regarded as US dollars.
Amount examplesLong net profit and lossShort net profit and loss
$100,000 nominal exposure, price −5%, cost $100−$5,100+$4,900
$100,000 notional exposure, price +5%, cost $100+$4,900−$5,100
This is a linear scenario conversion and does not assume real client or individual positions. If the account equity is only $20,000, the long loss on the first row represents 25.5% of equity instead of 5.1%; a different denominator significantly changes the interpretation of risk.

How to develop a more complete stress test

It first covers historically observable shocks, and then adds scenarios that exceed historical ranges; it also examines price gaps, spread widening, rising financing costs, and margin calls. Multi-asset portfolios should also check for declines in the same direction and hedging failures, and should not simply add the maximum drawdowns of each asset in different periods into a real portfolio loss. Risk limits need to correspond to available cash, position liquidation time and the ability to cover positions. When these inputs are not provided, the scenario amount can be calculated, but it cannot be judged that the loss is "affordable" or "in line with limits." The actual futures profit and loss should be verified based on the corresponding contract quotation, multiplier and daily settlement rules; non-linear products such as options need to be revalued.

Research conclusion

Historical drawdowns help understand path risk, and amount scenarios help judge the financial consequences of specific exposures, and both should be used together. Extreme losses that do not appear in historical samples may still occur; therefore this report does not package drawdown statistics into VaR, guaranteed losses or stop-loss commitments. View original drawdown · View bond interest rate sensitivity case Download Price Data. This report uses three of these price series to calculate drawdown. Prepared: January 2026. Download study computational abstract.

Related analysis projects

2025 Term Spread: Change Path and Observation Boundary

2025 Term Spread: Change Path and Observation Boundary

Split the contribution of the long and short ends to the term spread, analyze the different sources of curve steepening, and distinguish between portfolio risk and bank net interest margin.
2025 Multi-asset allocation research: returns, correlations and risk diversification

2025 Multi-asset allocation research: returns, correlations and risk diversification

Compare the full sample and short-term correlation, test the cross-asset performance of the equity index during the stress period, and clarify the applicable boundaries of the allocation conclusion.
2025 U.S. Treasury Yields: Changes in Short-End and Long-End

2025 U.S. Treasury Yields: Changes in Short-End and Long-End

Compare short-term and long-term yield levels on a quarterly basis and distinguish the different impacts of interest rate direction, yield curve shifts and cash flow valuation.