Research JournalResearch month 2025-02 · Prepared:January 2026

February review|USD price changes during the month

Olivia Rose Guthorn
February review|USD price changes during the month
Research month

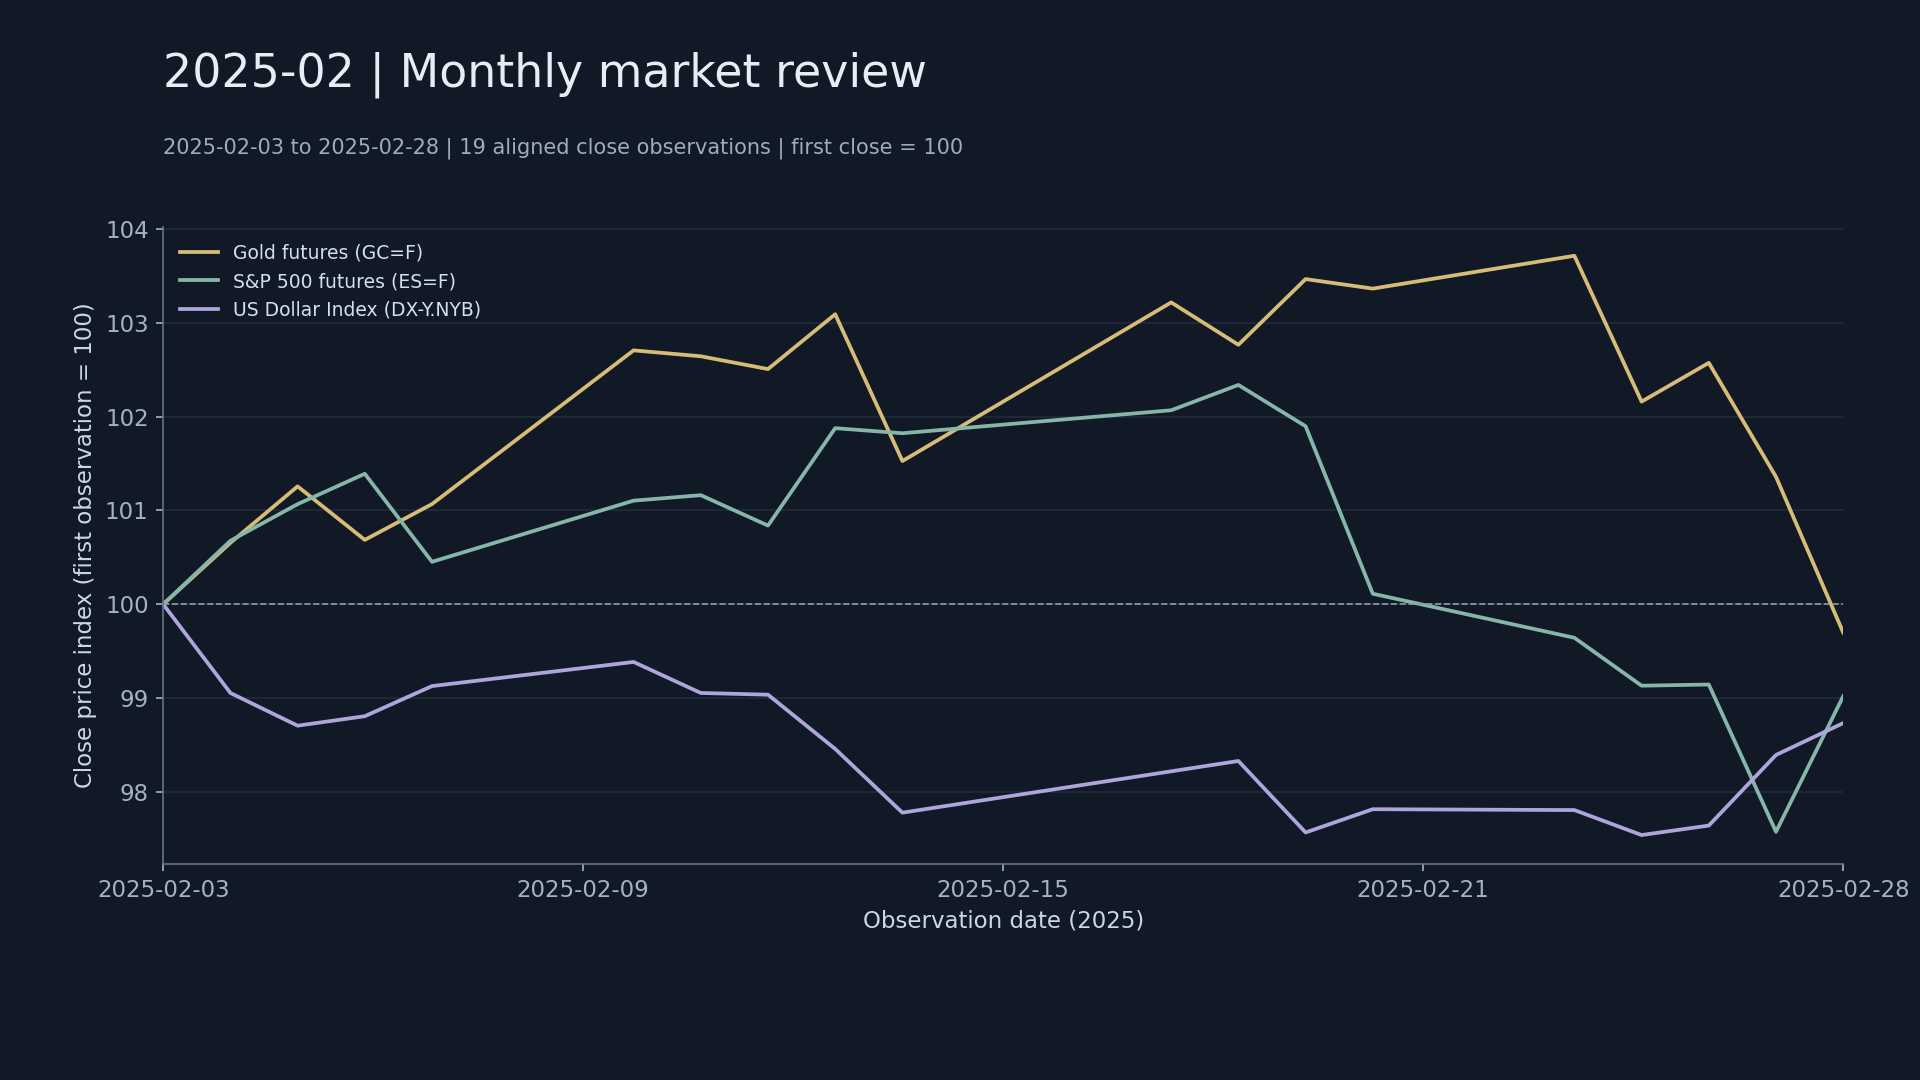
In February 2025, the observation period is from 2025-02-03 to 2025-02-28, 19 comparable trading days. This article is archived by research month, Prepared: January 2026.

Data for the current month

IndicatorsChanges within observation periods
Gold Futures GC=F-0.30%
S&P 500 Futures ES=F-0.98%
U.S. Dollar Index DX-Y.NYB-1.27%
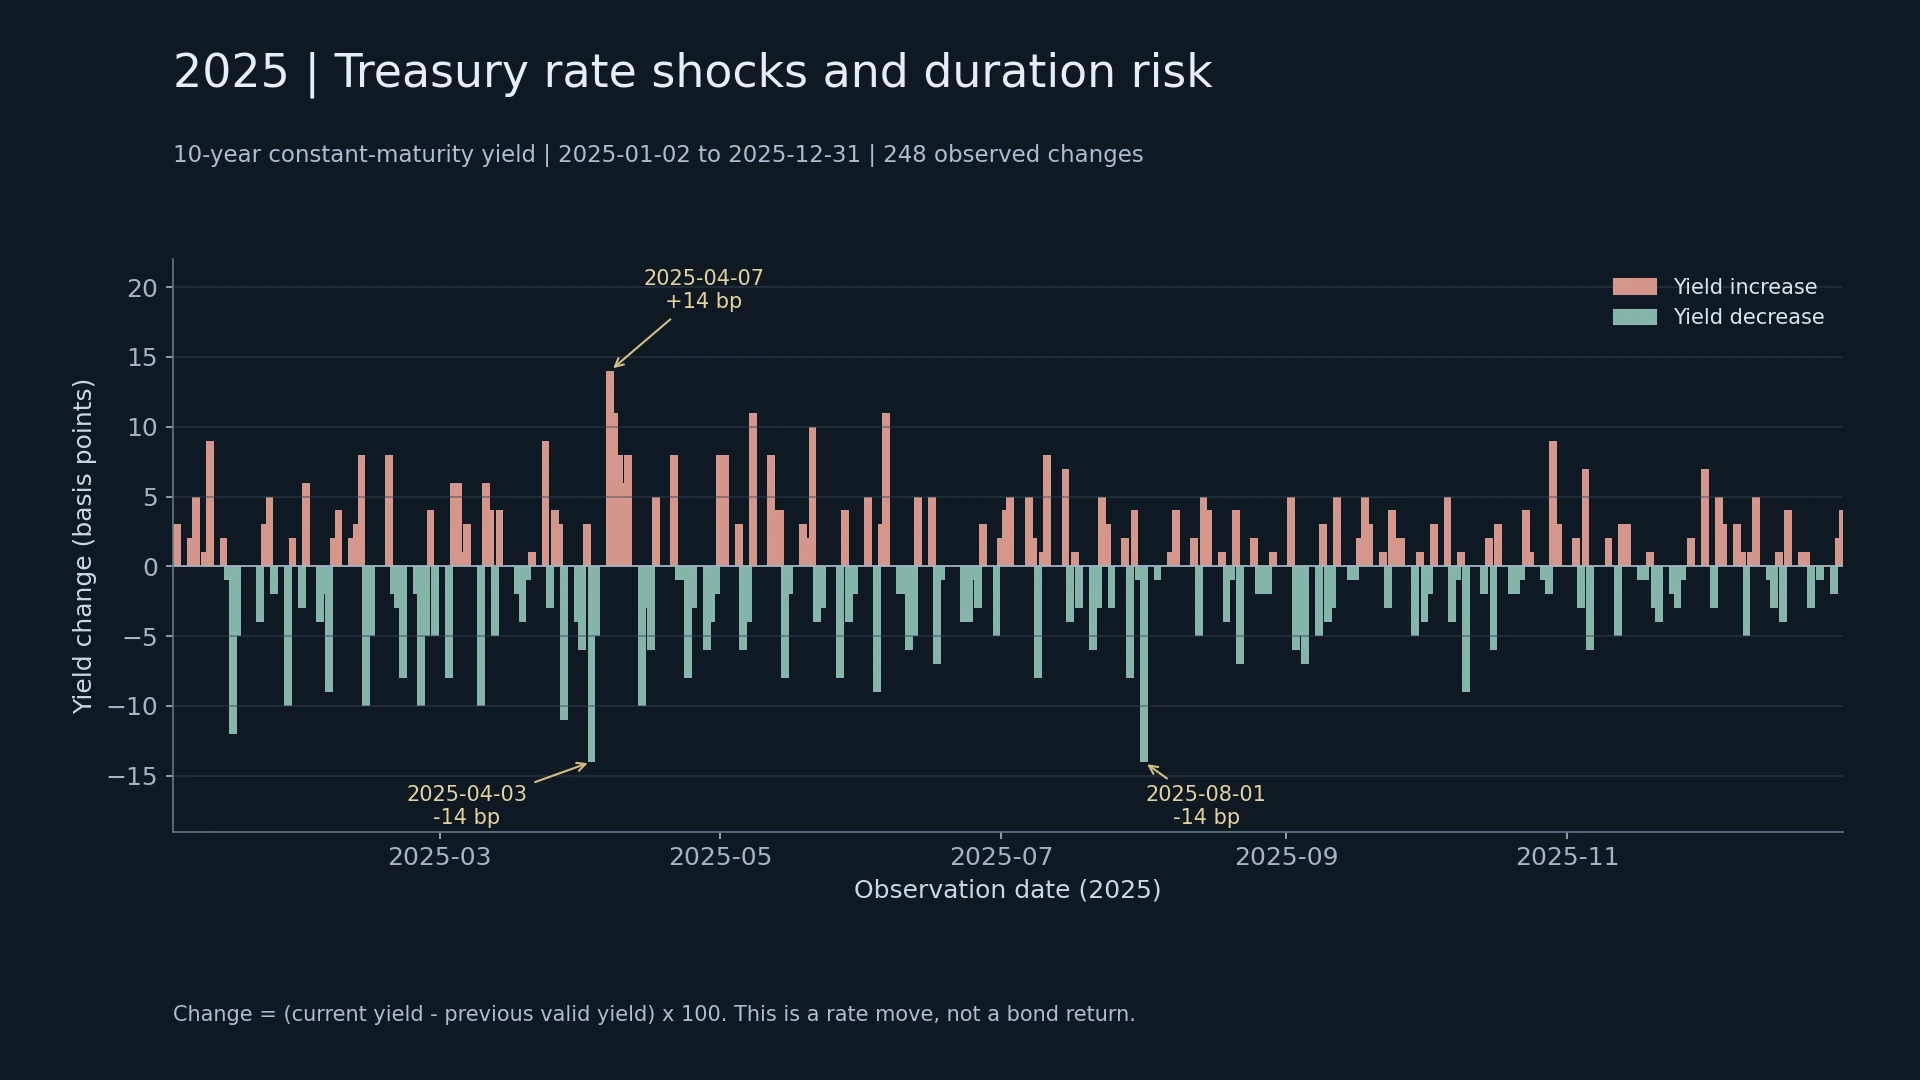
^TNX Yield-31.2 bp
To facilitate comparison, the three types of assets are displayed with the closing price on the first day of the observation period being 100. The range increase and decrease is calculated from the closing price of that day, and does not include price changes from the end of the previous month to the first day of this month.

Research questions

Will gold and the U.S. dollar continue to move in the same direction or in opposite directions this month?

Observations and Conclusions

Gold fell 0.30% within the statistical range, the equity index fell 0.98%, and the dollar fell 1.27%. The ranges of the three types of assets rise and fall in the same direction. It needs to be observed based on the process in the figure. The reasons cannot be judged just by the prices at the beginning and end of the period.

Follow-up review

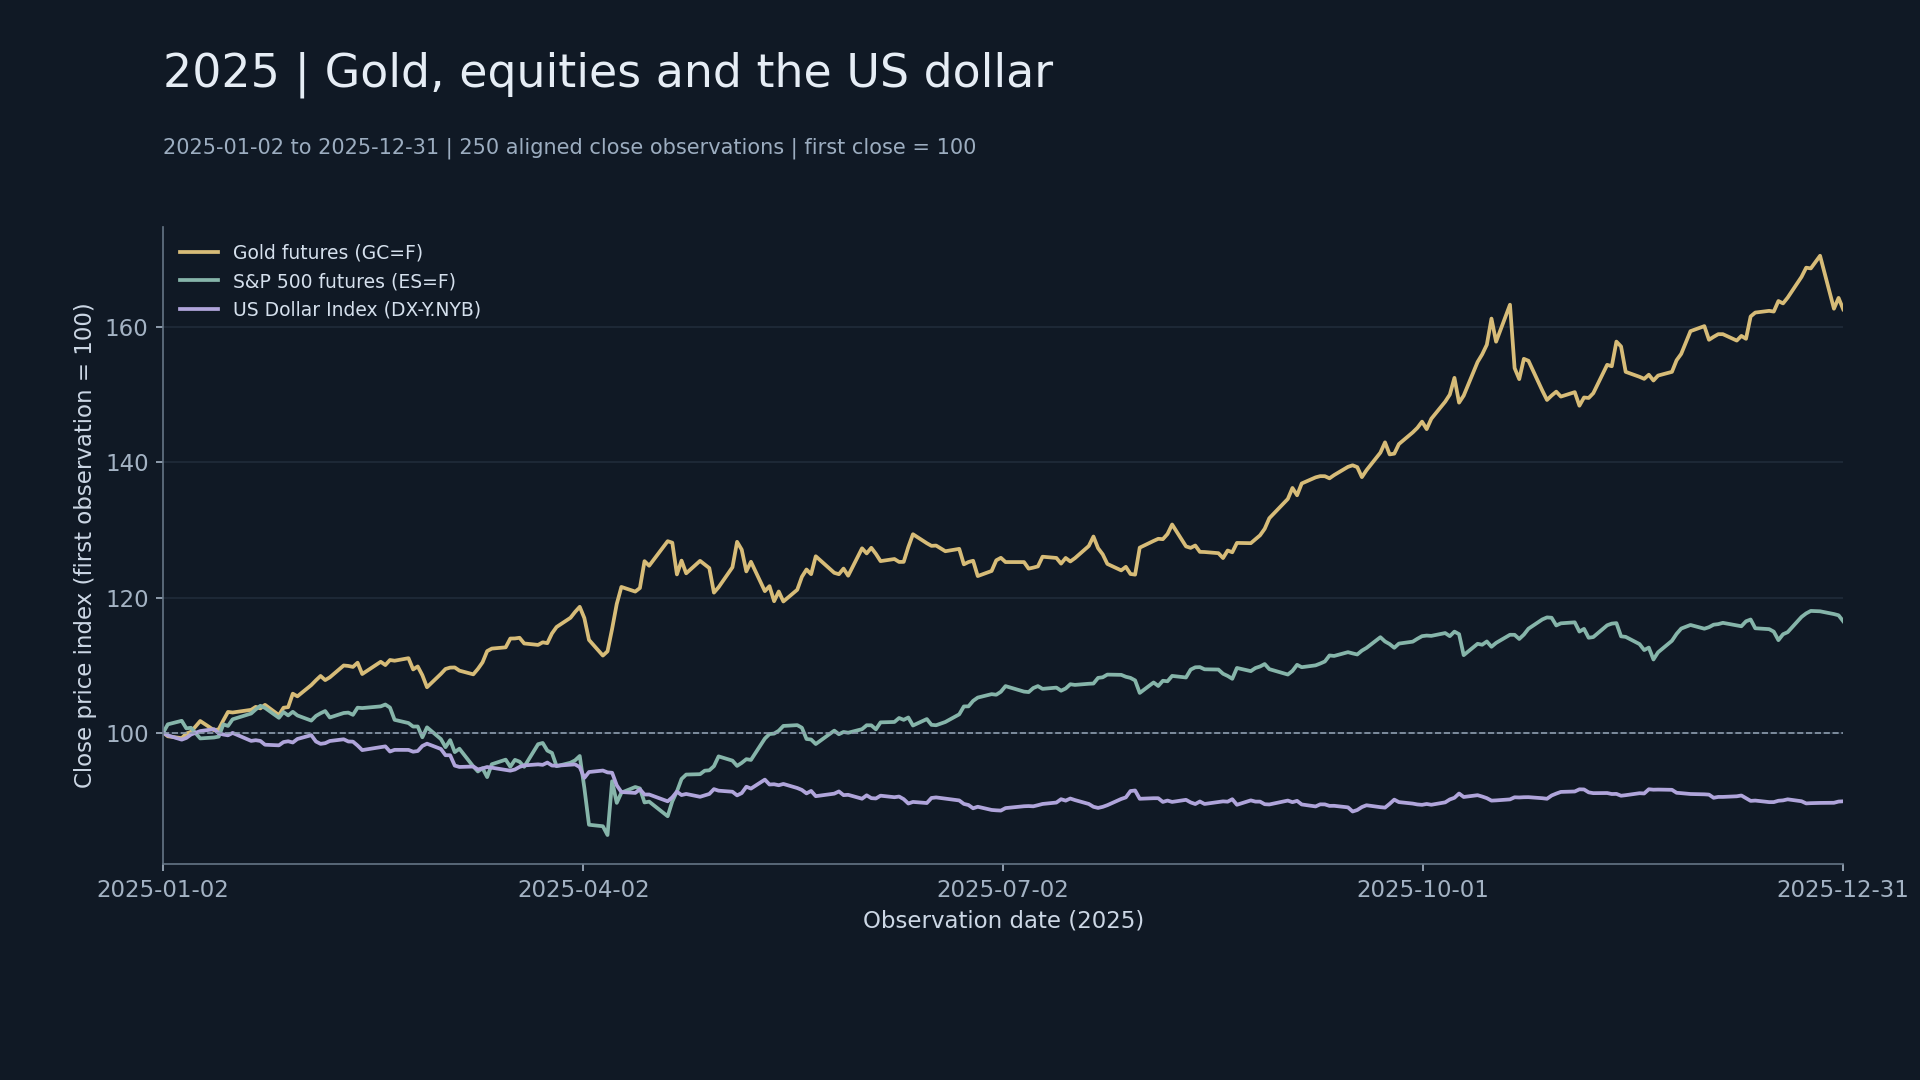
Continue to use the same comparable trading days and price increase and decrease calculation methods to compare with adjacent months and the full year chart. Examine whether short-term market relationships vary across observation periods and distinguish price changes from actual portfolio performance. Download 2025 Market Data CSV. Futures series may be affected by month changes.
Share article: